EUROSTAT: how Covid impacted enterprises (part 2)
The challenge of Covid
In the last chapter we saw how enterprises opening versus bankruptcy trends and R&D activity have changed during Covid. Let’s comment some more aspects impacted by pandemic.
We are still referring to the Eurostat Report on Key figures on European Business that you can find here.
Economy was challenged by the Covid-19 pandemic very much. In this article we will see how. We will answer the question:
“How Covid impacted enterprises?”
Which are the most impacted enterprises?
In general, the most impacted enterprises are:
- Industry
- Constructions
- Retail trade
- High-grow non-financial services, such as information services
- Low-grow non-financial services, such as tourism
How Covid impacted enterprises: Industry
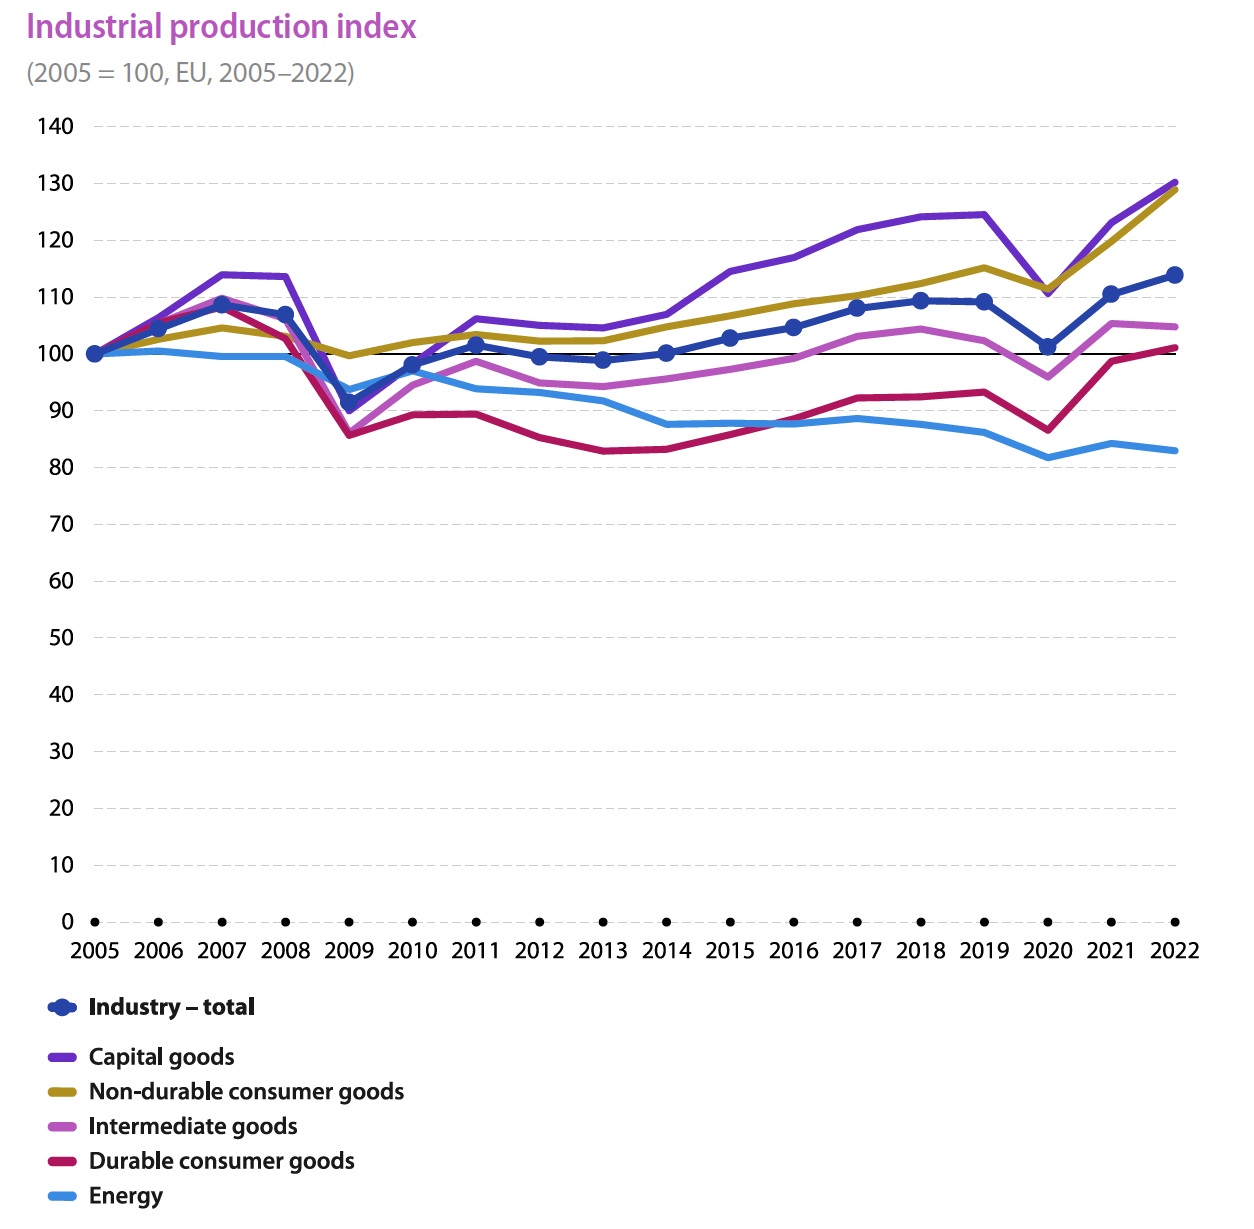
As shown in the charts below, it is not a surprise that industries and constructions have decreased dramatically their activities in 2020, after few years of continuous growth, following the recession associated with the global financial crisis of 2008 and 2009.
Industry saw its production index (volumes corrected by removing the impact of price change) contract for Covid. The average values decreased by -7,3%, with the mostly impacted type being the capital goods manufacturing (-11%). After Covid, the values rebounded in 2021 (+9,1%) and 2022 (+3,1%), bringing 2022 value at +4,3% compared with 2019.
Source: Eurostat
How Covid impacted enterprises: Constructions
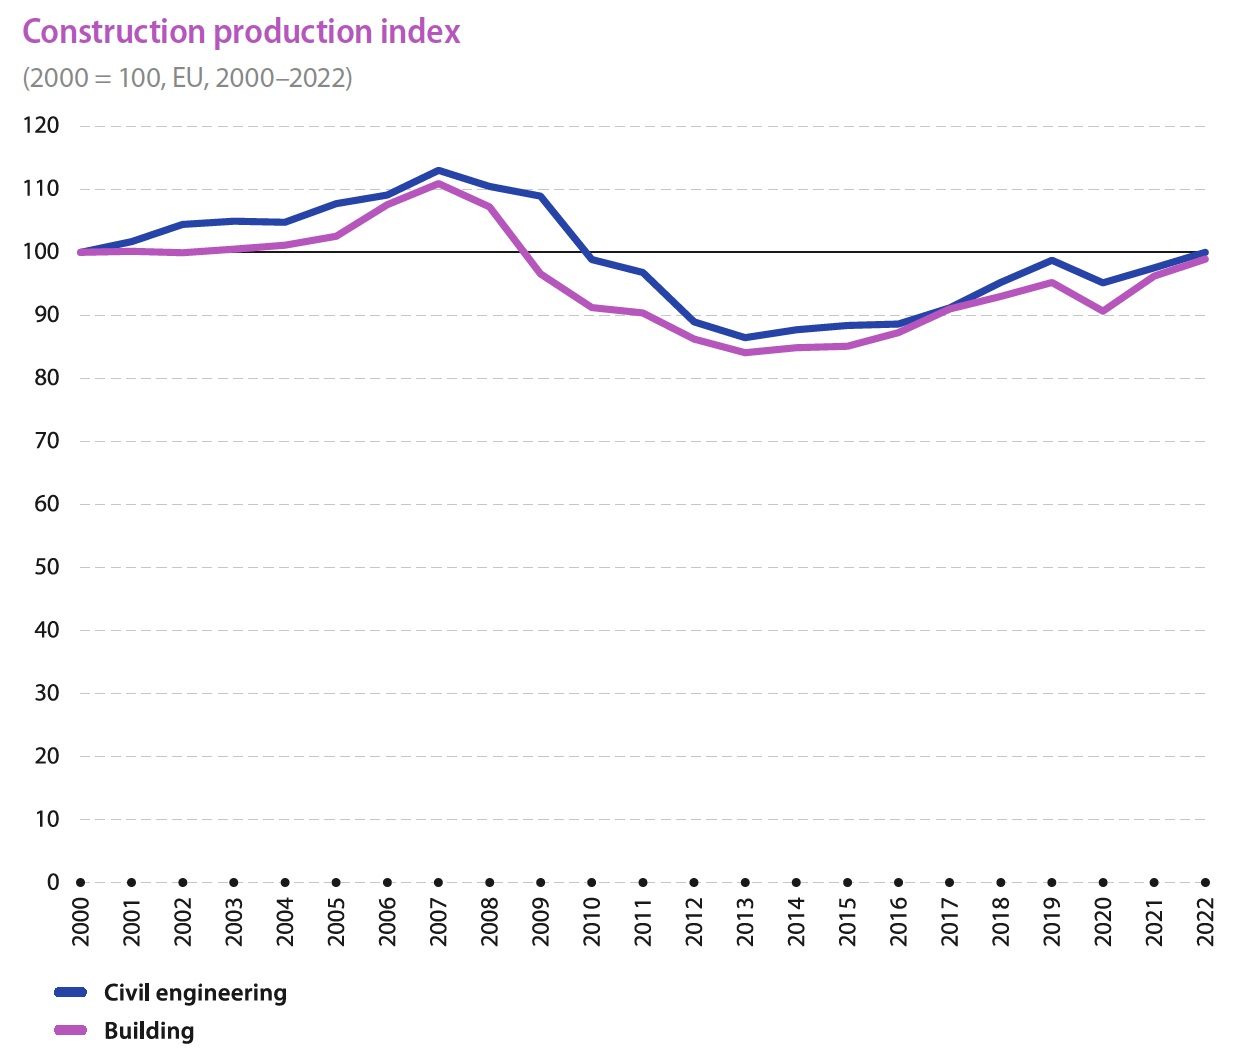
Constructions have suffered 2008-2009 crisis even more than industry, with a long and continuous decreasing of activities up to 2013, where the index started to go up again.
During the pandemic, both civil engineering and building construction have newly contracted, recording -4,8%. A minor decreasing, considering what had happened since 2007 to 2013.
The trend registered during 2021 and after, is very similar to the behaviour of manufacturing.
Source: Eurostat
How Covid impacted enterprises: Retail Trade
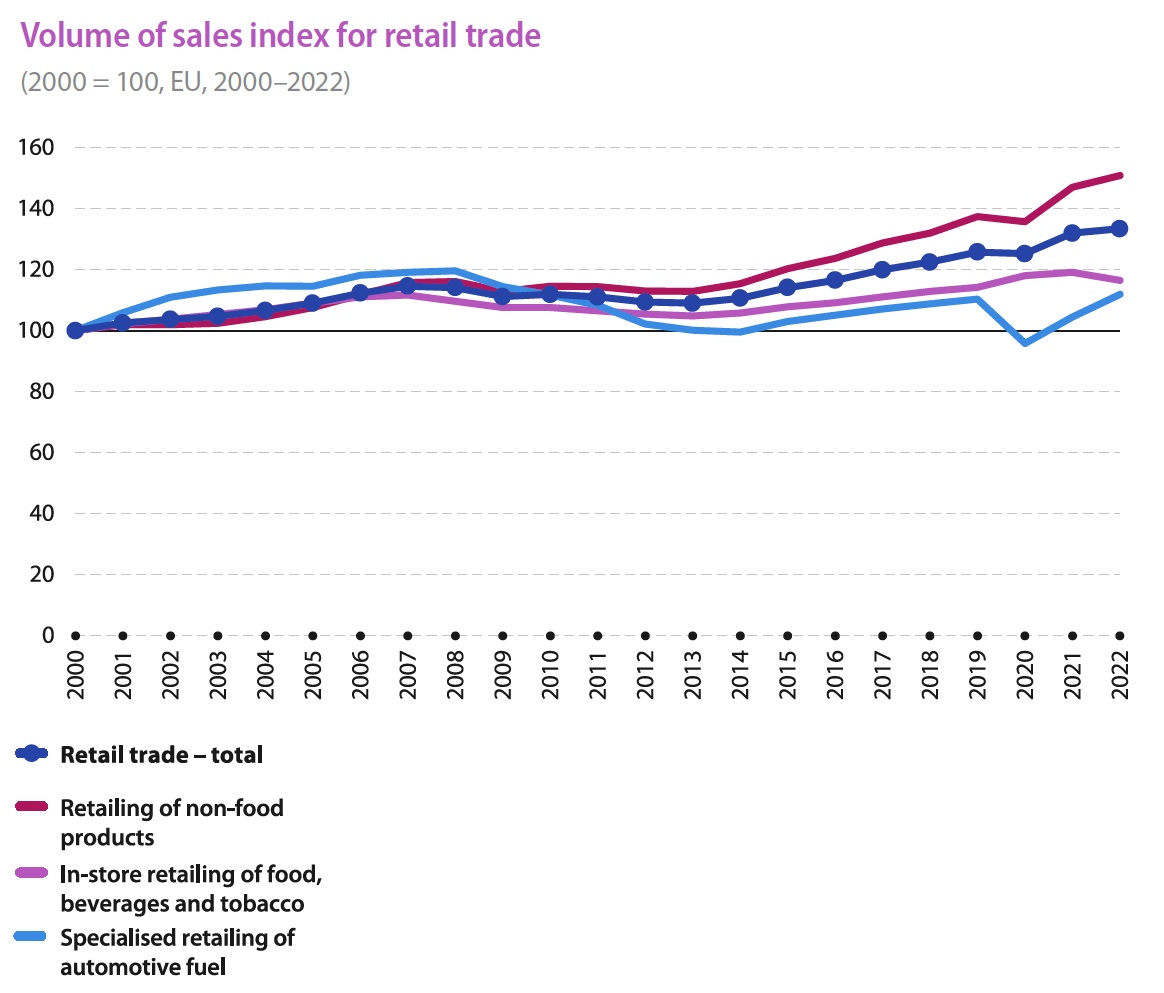
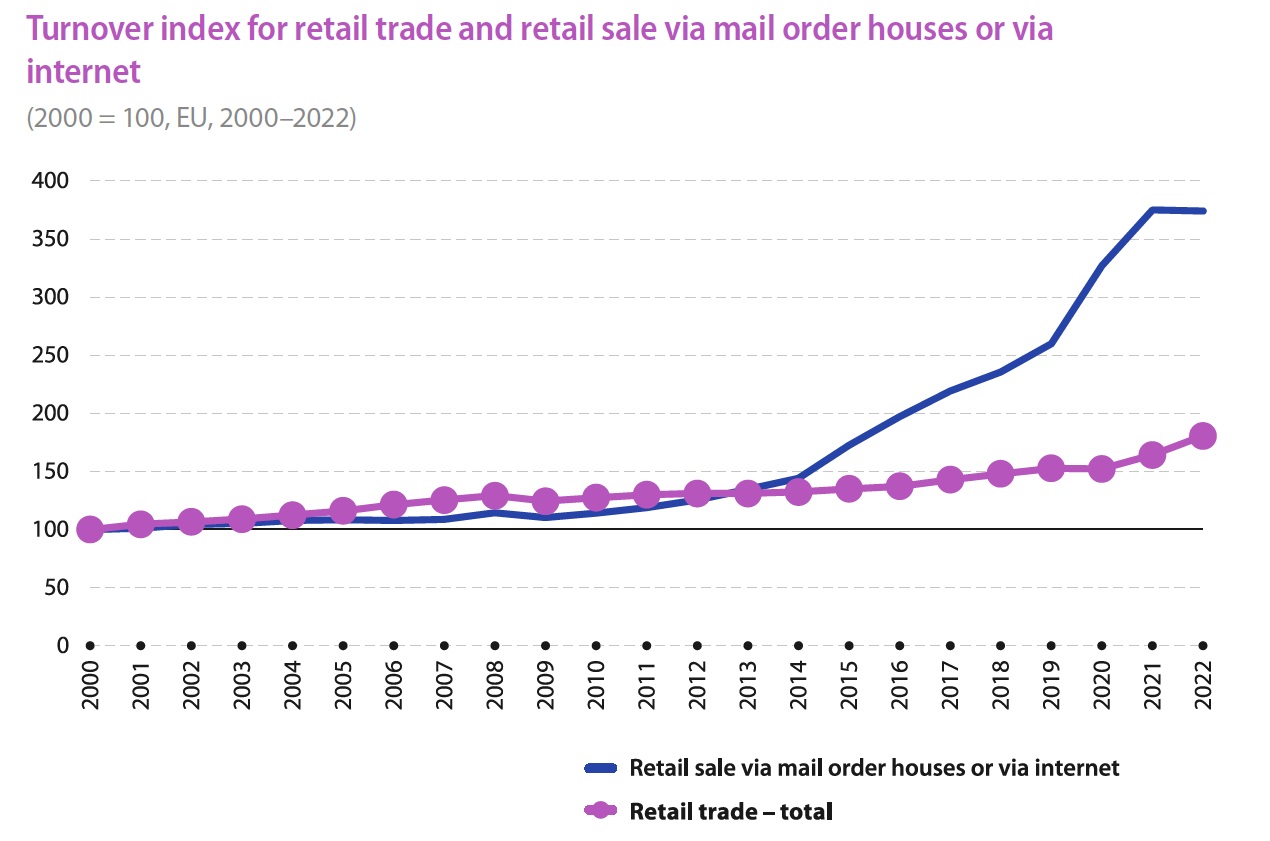
Totally different destiny, had distributive trade. In fact, with a small exception in automotive fuel retailing, the volume of sales index grew during the pandemic, registering the highest values for non-food products retailing. Do you remember how much couriers were working during the lockdown?
Source: Eurostat
To confirm these numbers, we can see the below chart, showing that trading online grew by +274% between 2000 and 2021, and then recorded a modestly contractive trend in 2022 of -0,3%, duainly to the end of sustained growth.
Source: Eurostat
How Covid impacted enterprises: Non-Financial Services
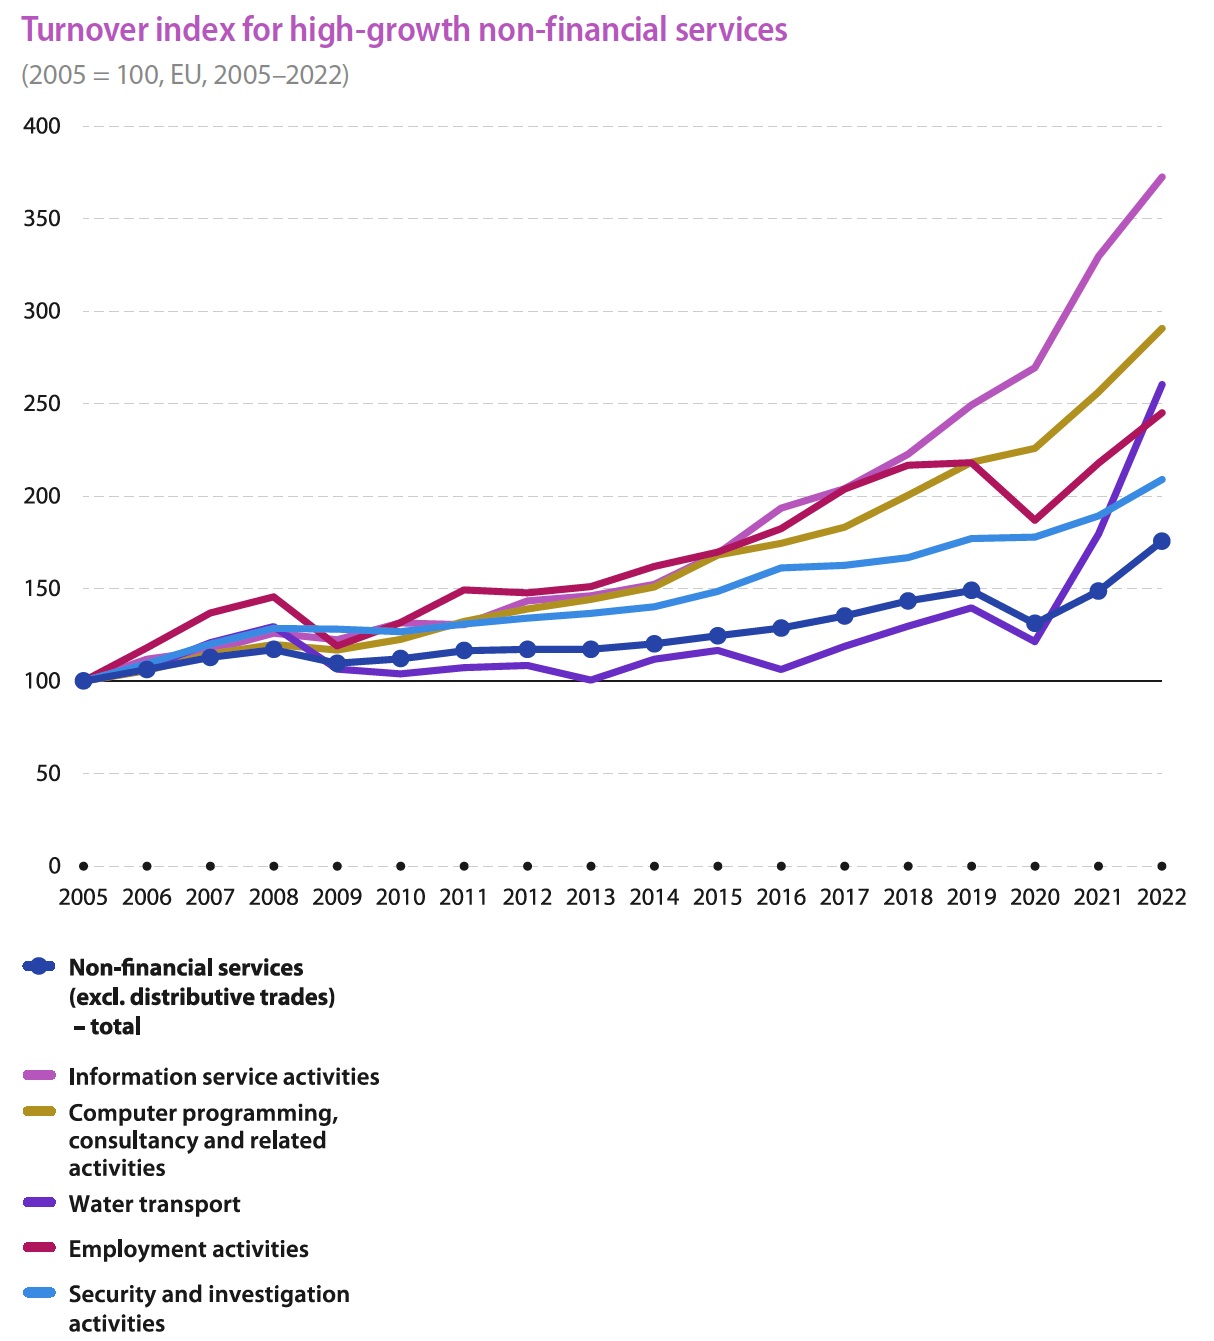
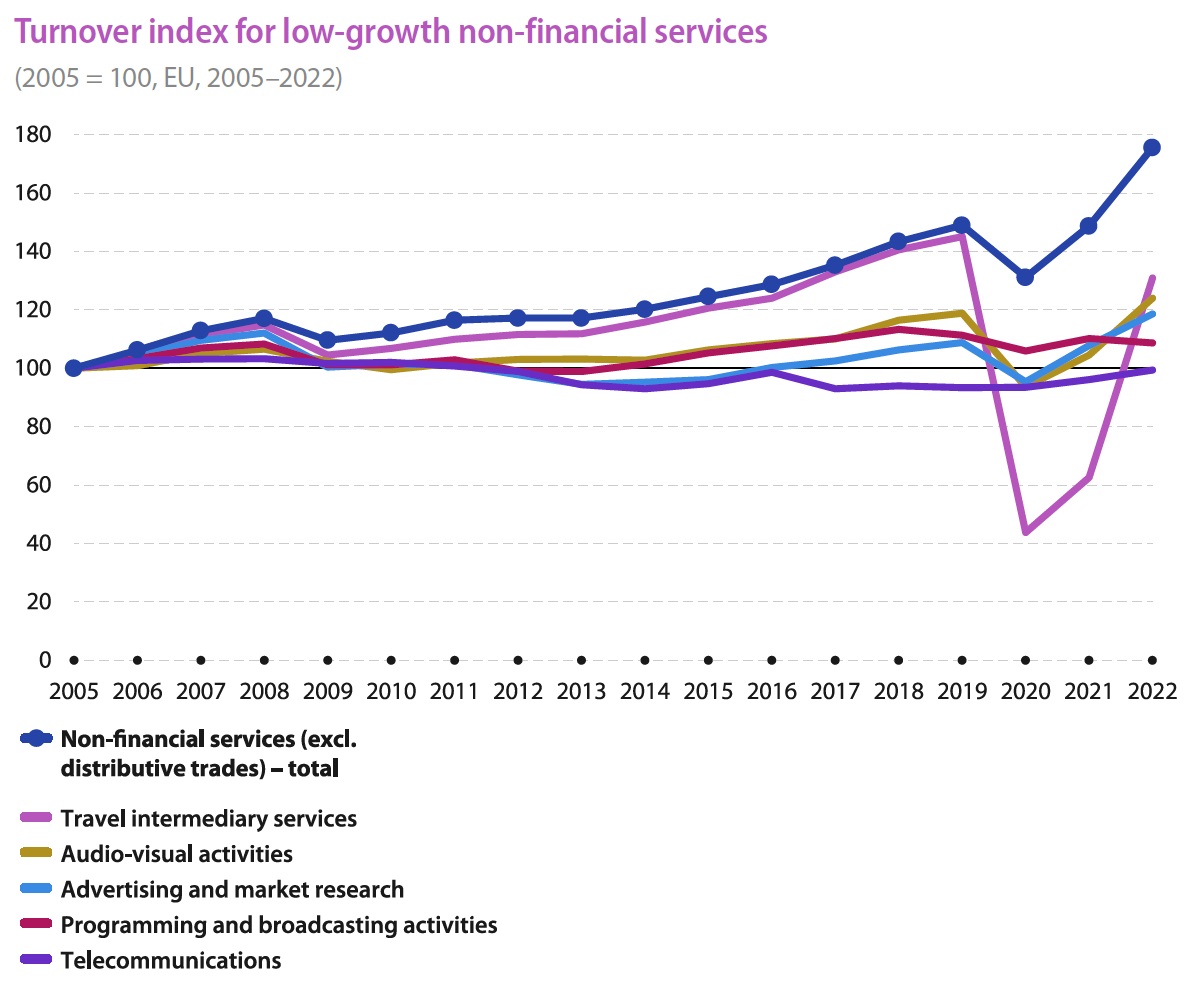
A very similiar picture can be observed for non-financial services (commercial trade excluded). We had a fall of 6,4% in 2009, and then another one of 12% for Covid-19 pandemic. The rebounds in 2021 and 2022 were +13,4% and 18,1%, respectively.
The fastest growing non-financial service was information service activities, with constant average yearly growth of 8,0%. It never decreased, and, on contrary, in 2020 it registered a spike in its development.
Source: Eurostat
Among the low-growth non-financial services, we just want to mention the tremendous falling of travel intermediary services, that, in 2020 (versus 2019), registered a loss of around -70%.
Source: Eurostat
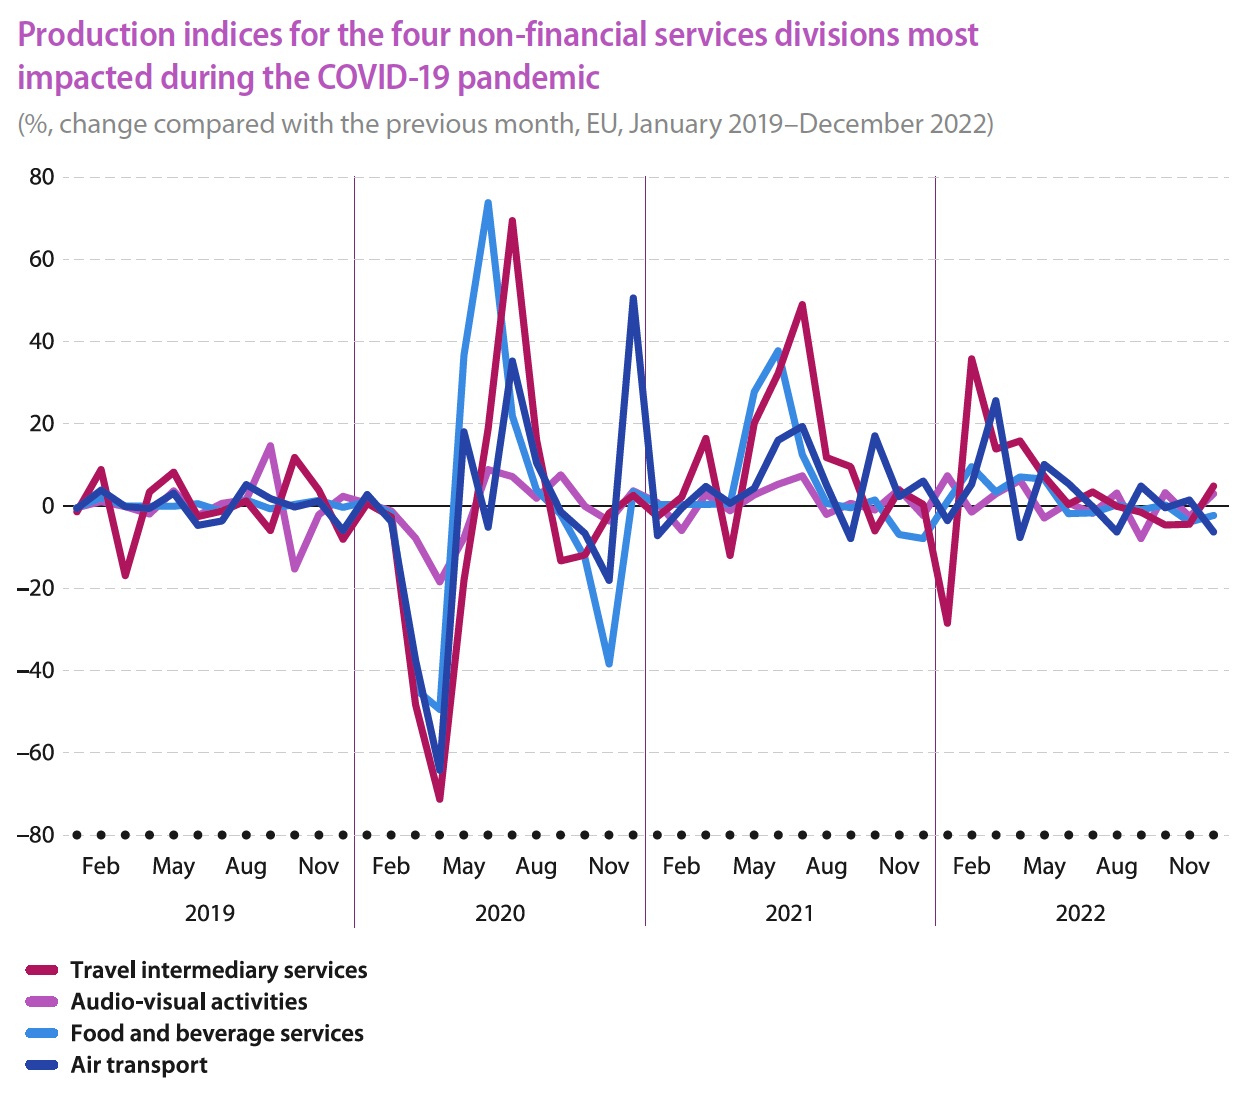
Finally, last chart displays the performance of the most impacted non-financial services by the pandemic over time. Besides the already mentioned tourism industry, we record audio-visual activities, food and beverage and air transport.

Source: Eurostat
HOW TO READ THE NUMBERS:
Covid-19 had a strong impact on all the kinds of enterprises, with very few exceptions. On average, the falling of economy during and after 2020 was more powerful than 2008-2009 recession. Instead, the years following the pandemic saw a robust rebound in some industries and services, but, on the other hand, some fields are still struggling to recuperate the values they had before 2020.
What can we learn from what happened? Shall we do anything differently? Those charts surely are a good food for thought for entrepreneurs.
For sure, Covid changed our way of thinking business and enterprise.
How much your field was impacted by Covid? How did you choose to adapt?
If you want to learn how to better increase your sales and cut your costs, please ask us!
Book a 20-minutes free introductive chat with us!
Aglaia, consultancy made simple.

