EUROSTAT – How Covid changed enterprises.
Knowing how enterprises reacted to the most recent economic challenges over years can help entrepreneurs take the right decision in the future. It is not a secret that pandemic changed business dynamics from many points of view. Knowing how Covid changed enterprises activities over years can help entrepreneurs have a deeper understanding.
Understanding the long term effects of these changes is essential for entrepreneurs in every field.
Eurostat recently released a report, mapping some interesting values over time.
- Business registration vs declaration of bankruptcy
- R&D
- Industrial production
- Construction production
- Distributive Trades
- Volume of sales
- Sales via mail or via internet
- Non-financial services
- Tourism volumes
How Covid changed enterprises.
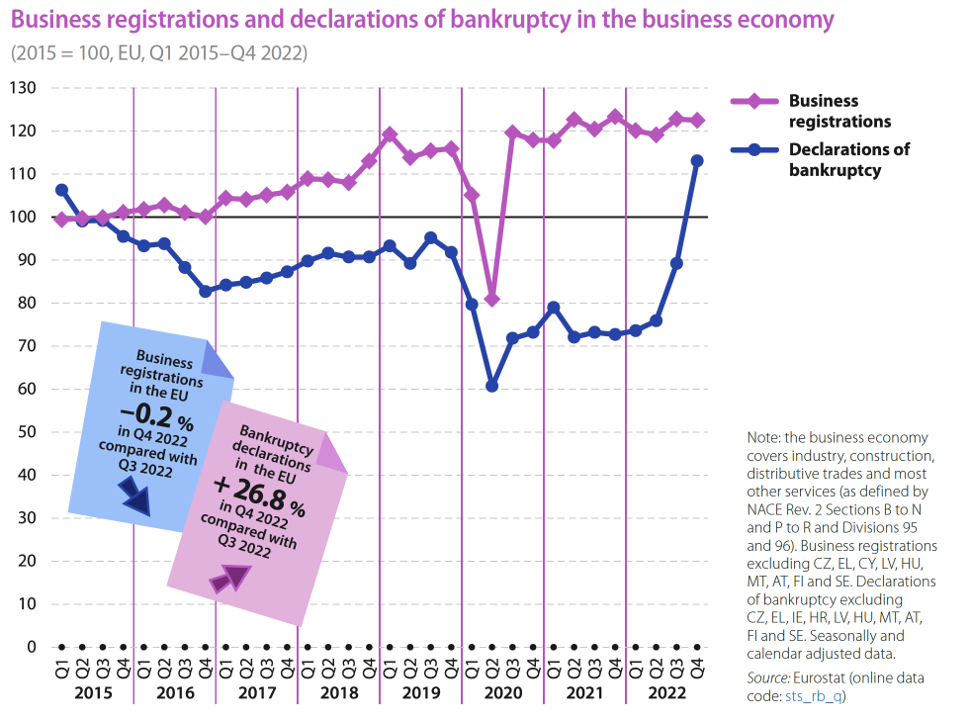
Business registrations and declarations of bankruptcy over time.
One important map is for sure business registrations versus declarations of bankruptcy over time.
A business registration is an administrative procedure that can be considered a declaration of intent. On the other hand, an enterprise bankrupt can early indicate the economy direction, because a company that files for bankrupt can be sold and not closed permanently. It is different from the company’s death, presented in our last article.
If we map both registrations and bankruptcy declarations over time, we can see quite constantly growing trends before the pandemic hit, and both values fell coherently. The curious data about what happened right after the pandemic is that company registrations continued to grow at a very similar rate as before Covid, while bankruptcies increased moderately if compared to before 2020, for a long while. This trend has unfortunately finished in 2022-Q3, when numbers came back to comparable values with the past.

Source: Eurostat
Business expenditure on R&D over time.
Another interesting value to analyse is R&D. With the exception of slight and curiously similar reductions in 2009 and 2020, EU business expenditure on R&D grew (in current price terms) between 2005 and 2021. Overall, business expenditure on R&D approximately doubled between 2005 and 2021, reaching €217 billion, which corresponds to €485 per inhabitant. These numbers are quite low if compared to USA and Japan, but the values are in continuous growth (excepted during pandemic).
We can observe that both during the 2009 economical default and during the Covid pandemic, R&D expenditure had negative flexes. The interesting observation is that, whereas after the crisis in 2009 R&D expenditure grew with a slower slope, after the first wave of Covid in 2020 the trend came back to a stable growth shortly after that.

HOW TO READ THE NUMBERS:
Pandemic certainly changed a lot of rules in enterprise world in EU. Business registrations, bankruptcy and R&D expenditure trends have been strongly impacted by Covid, but in very different ways. A deep analysis about how it went, with a comparison with other recent historical events could help entrepreneurs to get ready for the next challenge.
Please stay tuned to read the rest of the analysis in the next articles.
In the meantime, if you want to increase your business and cut your costs, ask for a free introduction meeting with us!

